Composition
Body composition: where your weight comes from
Why BMI and body fat together say more than each one alone, and where the limits are: essential fat and natural lean mass.
· · 8 min read
Key points
- Weight and body fat together show where your weight comes from.
- Below essential fat is a warning at any weight; above the natural lean mass limit, it is worth checking the reading.
- Athletic build and balanced are equally good: being leaner is not being healthier.
BMI says whether your weight is high for your height, but not whether that weight is muscle or fat. Body fat says how much of your weight is fat, but not whether your weight is high. Looking at both together, you can tell where your weight comes from.
The profiles
CatLena combines the WHO BMI range with the body fat range from Gallagher and colleagues for your sex and age [1][2], and adds two limits: essential fat and the natural lean mass limit, explained below. Example for a man aged 20 to 39:
| BMI | Body fat (man, 20–39) | Profile | CatLena's reading |
|---|---|---|---|
| any | below 5% | Body fat below essential | Attention |
| 18.5 to 24.9 | 5% to 12% | Athletic build | Good |
| 18.5 to 24.9 | 12% to 20% | Balanced | Good |
| 25 or more | 5% to 20%, within the natural limit | Heavy from lean mass | Good |
| 25 or more | 5% to 20%, above the natural limit | Lean mass above natural | Attention |
| up to 24.9 | 20% to 25% | Normal weight, high fat | Could improve |
| 25 or more | 20% to 25% | High weight and fat | Could improve |
| below 18.5 | 5% to 20% | Underweight | Attention |
| up to 24.9 | 25% or more | Normal weight, high fat | Attention |
| 25 or more | 25% or more | Very high weight and fat | Attention |
Body fat below essential
Part of body fat is essential: it sits in the nerves, bone marrow and cell membranes, and you cannot lose it without harming how the body works. In Behnke's reference man and woman, used in exercise physiology textbooks, it is about 3% in men and 12% in women [3].
Getting close to it is possible, but only for a short time and at a cost. In a case study, a natural bodybuilder reached 4.5% body fat by the end of his contest preparation. Over that period, his testosterone dropped by about 75%, his resting heart rate went down to 27 beats per minute and his mood got much worse. His testosterone returned to baseline after the competition, during a recovery in which his body fat went back to about 15% [4]. That is why CatLena flags body fat below 5% in men and 13% in women as Attention, at any weight.
How far lean mass goes
A high weight with healthy body fat means a lot of lean mass. But lean mass has a limit too. It is measured by the fat-free mass index (FFMI): lean mass in kilograms divided by height squared, with a small height adjustment for men.
Kouri and colleagues measured 157 male strength athletes. Among those who did not use anabolic steroids, the index reached at most 25; among those who did, it easily went past that, sometimes above 30. Mr. America winners from before steroids (1939 to 1959) averaged 25.4 [5]. There is less data for women: in a group of 372 college athletes, 97.5% were below about 24 [6].
So, with a BMI of 25 or more and healthy body fat, CatLena only says "heavy from lean mass" while the index stays at or below 25 (men) or 24 (women). Above that, it shows "lean mass above natural" (in very short people, this can happen with a BMI just under 25). In practice, the most common reason is the body fat reading: bioimpedance scales can read several points too low in very muscular people. It is worth checking the reading with another method.
Athletic build and balanced
With a normal BMI, CatLena sets apart the first four percentage points of the healthy body fat range (and the very low range, above essential) as "athletic build": a leaner body. The rest of the healthy range is "balanced". Both are Good, on purpose: being leaner within the healthy range is not being healthier.
A meta-analysis of 35 studies with about 920,000 people found that the risk of death is lowest near 25% body fat and rises both above and below it [7]. The difference between athletic build and balanced is about looks and performance, not health.
Normal weight, high fat
BMI is in the normal range, but body fat is above healthy. Researchers call this "normal weight obesity", and it is linked to more metabolic and cardiovascular changes than normal weight with healthy body fat [8]. BMI alone does not show it.
Same body fat, different bodies
The same body fat percentage shows up in very different bodies. What changes is lean mass (muscle, bone, organs and water), and with it weight and BMI. That is why neither number, on its own, describes the body.
| Man, 1.75 m | Body fat | Weight | BMI | Lean mass |
|---|---|---|---|---|
| Lean, little muscle | 10% | 60 kg | 19.6 | 54 kg |
| Average muscle | 10% | 75 kg | 24.5 | 67.5 kg |
| Average muscle | 35% | 90 kg | 29.4 | 58.5 kg |
| A lot of muscle (strength athlete) | 35% | 110 kg | 35.9 | 71.5 kg |
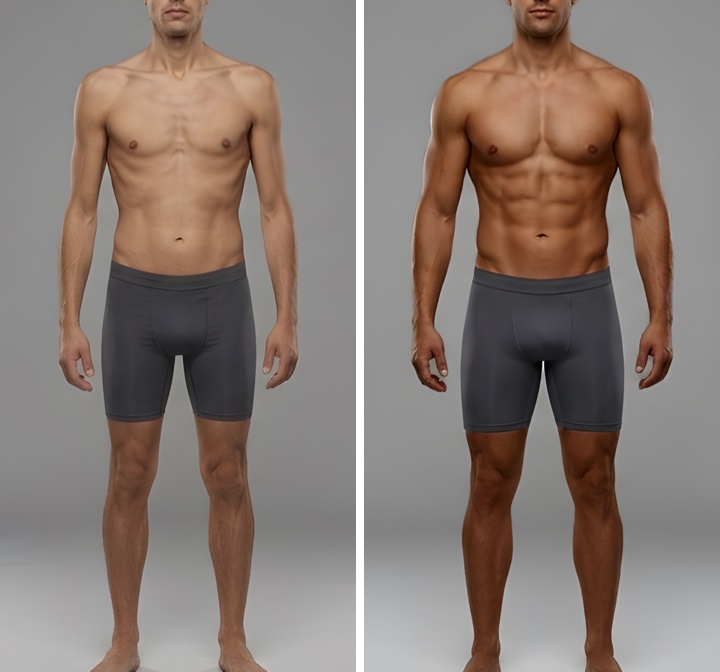
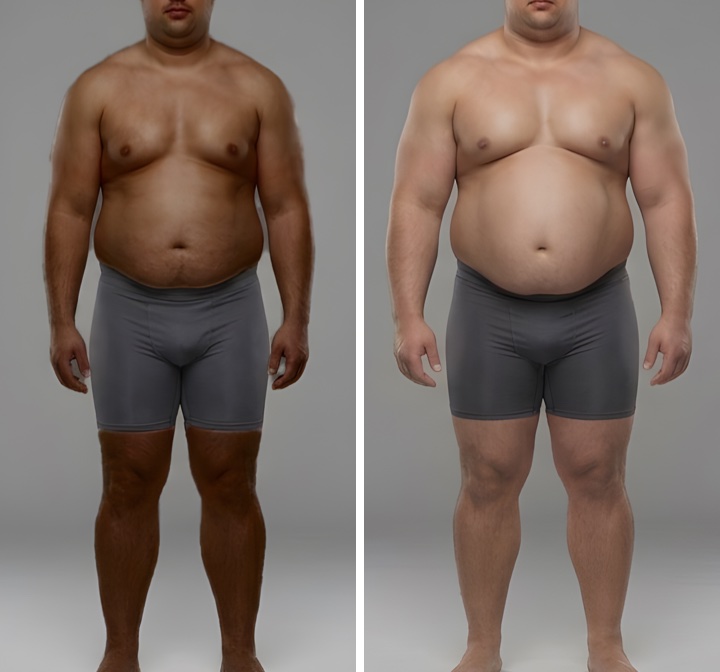
In all four cases the math is the same: lean mass = weight × (1 − body fat percentage). At 10% body fat, the 15 kg difference between the two bodies is all lean mass. That is why, in the app reference images, the same percentage appears in more than one body type.
The gauge and the four groups
Each profile falls into one of four groups, and the gauge needle points to yours. The Good group has two halves at the same level: blue for balanced or heavy from lean mass, and green for athletic build.
- AttentionBody fat below essential or very high, underweight, or lean mass above natural
- Could improveNormal weight with high fat, or high weight and fat
- GoodBalanced or heavy from lean mass
- Good · athleticAthletic build
The BMI × body fat percentage map
The map puts it all in one figure. The vertical axis is BMI, with the WHO cut-offs at 18.5 and 25. The horizontal axis is body fat, with the cut-offs for your sex and age: essential fat, start of the healthy range, end of athletic build, start of the high range and start of the very high range. Each area is painted in its group's color. The dashed line is the natural lean mass limit for your height: above it, weight can no longer be explained by muscle alone, and the area turns red.
In the example above, each color covers these areas:
- Green · Good · athleticBMI 18.5 to 24.9 with 5% to 12% body fat.
- Blue · GoodBMI 18.5 to 24.9 with 12% to 20% body fat (balanced), or BMI 25 or more with up to 20% body fat, below the dashed line (heavy from lean mass).
- Yellow · Could improveBody fat from 20% to 25%, at any BMI.
- Red · AttentionBody fat of 25% or more, or below 5%, at any BMI; BMI below 18.5 with up to 20% body fat; or above the dashed line.
How CatLena uses it
The Body composition block combines BMI and body fat: it shows your profile, the gauge and your point on the map. In the real example, a BMI of 23.6 with 14.5% body fat gives the Balanced profile, with the gauge at Good.
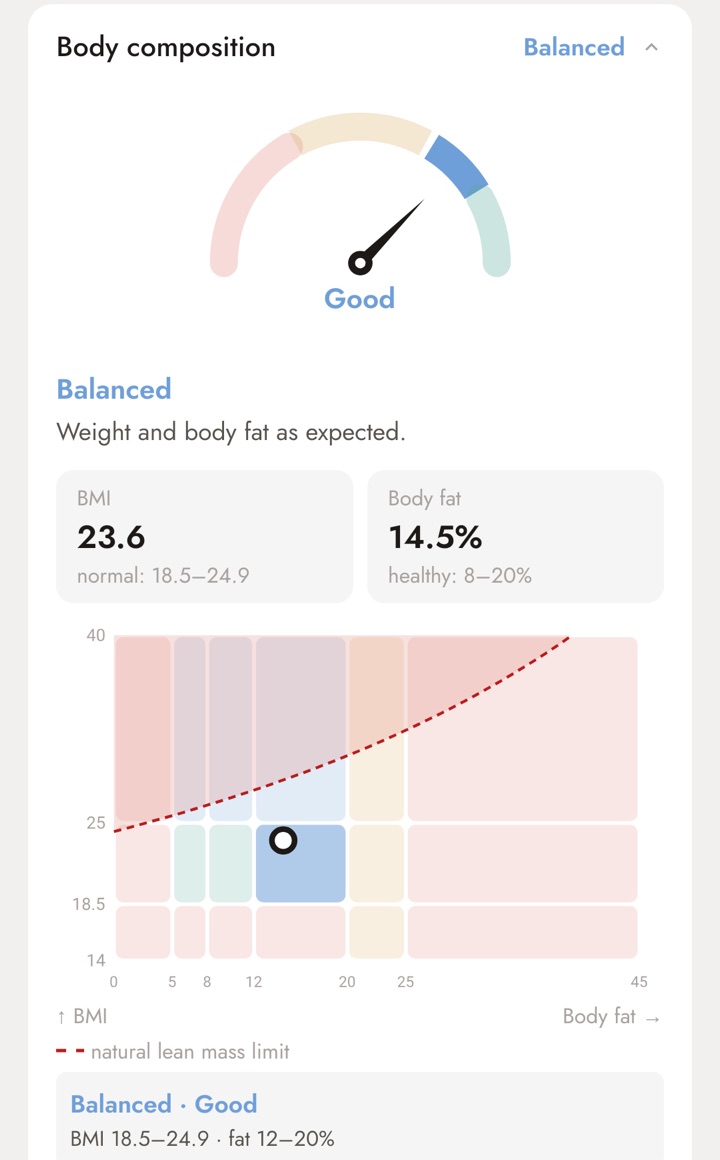
- The Body composition card shows the gauge, your profile, your numbers and the fat-free mass index.
- The BMI × body fat percentage map shows where you are, the limits of each profile and, dashed, the natural lean mass limit for your height.
References
- World Health Organization. Obesity: preventing and managing the global epidemic. Report of a WHO consultation. WHO Technical Report Series 894. Geneva: WHO, 2000. See the study
- Gallagher D, Heymsfield SB, Heo M, Jebb SA, Murgatroyd PR, Sakamoto Y. Healthy percentage body fat ranges: an approach for developing guidelines based on body mass index. American Journal of Clinical Nutrition, 2000;72(3):694–701. See the study
- McArdle WD, Katch FI, Katch VL. Exercise Physiology: Nutrition, Energy, and Human Performance. Wolters Kluwer. Body composition chapter: essential fat of Behnke's reference man and woman (about 3% and 12%).
- Rossow LM, Fukuda DH, Fahs CA, Loenneke JP, Stout JR. Natural bodybuilding competition preparation and recovery: a 12-month case study. International Journal of Sports Physiology and Performance, 2013;8(5):582–592. See the study
- Kouri EM, Pope HG Jr, Katz DL, Oliva P. Fat-free mass index in users and nonusers of anabolic-androgenic steroids. Clinical Journal of Sport Medicine, 1995;5(4):223–228. See the study
- Harty PS, Zabriskie HA, Stecker RA, et al. Upper and lower thresholds of fat-free mass index in a large cohort of female collegiate athletes. Journal of Sports Sciences, 2019;37(20):2381–2388. See the study
- Jayedi A, Khan TA, Aune D, Emadi A, Shab-Bidar S. Body fat and risk of all-cause mortality: a systematic review and dose-response meta-analysis of prospective cohort studies. International Journal of Obesity, 2022;46(9):1573–1581. See the study
- Oliveros E, Somers VK, Sochor O, Goel K, Lopez-Jimenez F. The concept of normal weight obesity. Progress in Cardiovascular Diseases, 2014;56(4):426–433. See the study
See this math done for you
In CatLena, you log workouts, meals and measurements (or just chat with CatLena) and the app does this math for you, every day, on your computer and phone.
Get started