Energy
Stamina: how CatLena estimates your glycogen
What glycogen is, how much your body can store and how CatLena estimates the store day by day, with the studies behind it and worked examples.
· 8 min read
Key points
- Glycogen is the carbohydrate stored in your muscles and liver, the fuel for hard workouts.
- CatLena estimates how much you can store, adds what you eat and subtracts what workouts burn, day by day.
- The % on the Nutrition card is your store right now: meals already marked as eaten and workouts already done.
- It is a model: it tracks day-to-day change well, but the exact value can be off by about 30% to 40%.
The body stores carbohydrate as glycogen: most of it in the muscles (about 500 g in an adult) and a smaller part in the liver (about 100 g) [1]. It provides much of the energy for harder workouts. When the store is low, training feels heavier. CatLena’s stamina is an estimate of that store, in grams and as a percentage of how much fits.
Nobody measures glycogen at home: it takes a biopsy or an MRI scan. So CatLena uses a balance model, like a bank statement. There is an account size (how much fits), deposits (the carbohydrate you eat) and withdrawals (what workouts and the body itself burn).
A day in practice
The Stamina card on the Nutrition screen shows your store right now: what you had at the end of yesterday, plus the carbohydrate from meals you have already marked as eaten, minus the workouts you have already marked as done. The resting use of the brain and the rest of the body is taken out for the whole day first thing in the morning, so the number drops when the day starts and rises as you mark meals. Planned meals and workouts that have not happened yet do not count.
Here is a day for a 70 kg man with 15% body fat and a VO₂ max of 52 (capacity of about 634 g):
| Moment | What CatLena counts | Stamina on the card |
|---|---|---|
| End of yesterday | Starting point | 480 g · 76% |
| Woke up, nothing marked | Takes out the day’s resting use: 120 g (no protein yet) | 360 g · 57% |
| Breakfast marked | 60 g carbohydrate, 8 g fiber, 30 g protein | 423 g · 67% |
| Lunch marked | For the day: 150 g carbohydrate, 20 g fiber, 70 g protein | 515 g · 81% |
| Run done | 600 kcal at an average heart rate of 150: −89 g | 426 g · 67% |
| Dinner marked | For the day: 250 g carbohydrate, 30 g fiber, 120 g protein | 533 g · 84% |
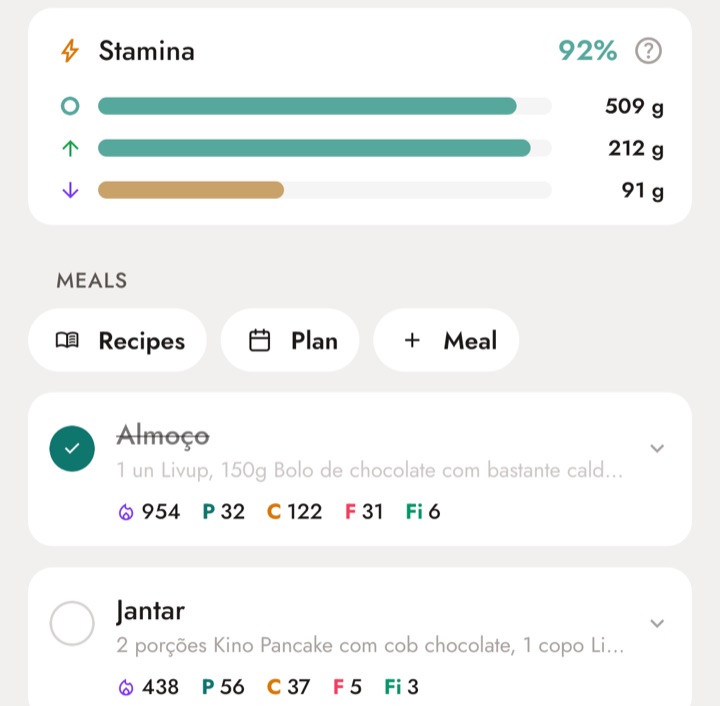
In the real example below, the card shows 509 g of glycogen (92% of capacity), 212 g of carbohydrate already eaten and 91 g used in the day, counting rest and training.
1. How much fits: capacity
- Lean mass = weight × (1 − body fat %), using the measurements from the Body screen.
- Muscle = a share of lean mass, estimated by sex: 53% in men and 45% in women (50% if sex is not in the profile). An MRI study of 468 adults found muscle to be about 38% of body weight in men and 31% in women [2], which is roughly those shares of lean mass.
- Muscle glycogen = muscle × K, in grams per kilogram of muscle.
- Liver glycogen = 1.4 g per kg of body weight, about 100 g in a 70 kg adult. Direct measurements show it rises after meals and falls in the hours that follow [3].
K rises with fitness. A meta-analysis of 181 studies found about 17 g of glycogen per kg of muscle in men with a VO₂ max near 53, and about 2.5 g more for every 10 points of VO₂ max [4]. CatLena suggests K from your VO₂ max, in steps:
| Your VO₂ max (ml/kg·min) | Suggested K (g per kg of muscle) |
|---|---|
| below 40 | 13 |
| 40 to 50 | 15 |
| 50 to 60 | 17 |
| above 60 | 19 |
2. What comes in: food
- Carbohydrate minus fiber comes in, because fiber does not turn into glucose [5].
- The brain and nervous system use about 120 g of glucose a day, even at rest. That need is the basis for the minimum carbohydrate recommendation of 130 g a day [5].
- Part of that glucose comes from protein, through gluconeogenesis. CatLena counts 0.35 g of glucose per gram of protein, up to 60 g a day. That sits between the theoretical maximum (0.5 to 0.8 g per gram) [6] and what was measured in people in the first hours after a meal (about 0.17 g per gram) [7].
- The rest of the brain’s use comes out of glycogen, with a minimum of 40 g a day.
- The store does not fill by more than 2.5 g per kg of body weight a day. This is a conservative CatLena limit: in the hours after training, muscle can store much faster than that [8][9].
3. What goes out: workouts
For a run or walk, CatLena takes the workout calories and works out how much came from carbohydrate: glycogen used = calories × carbohydrate fraction ÷ 4 (each gram of carbohydrate has about 4 kcal). The fraction rises with intensity: easy workouts burn more fat, hard workouts burn more carbohydrate. This is the "crossover" concept [10].
Intensity comes from average heart rate as a percentage of your maximum. If you do not enter your maximum, CatLena estimates it as 211 − 0.64 × age, from a study of 3,320 adults who did a maximal test; the typical error is about 11 beats per minute [11].
| % of max heart rate | Carbohydrate fraction used by CatLena |
|---|---|
| 50% | 20% |
| 60% | 30% |
| 70% | 45% |
| 80% | 60% |
| 90% | 80% |
| 100% | 90% |
This curve is a CatLena approximation based on the crossover concept. In trained cyclists measured in the lab, carbohydrate was about 46% of energy at 44% of VO₂ max, 51% at 57% and 76% at 72% [12]. CatLena’s curve is lower at easy intensities, so it tends not to overstate glycogen use on easy days. Heart rate comes from Strava. Without it, for a run CatLena uses your pace compared with your VO₂ max; walks without heart rate, or runs without a VO₂ max, are left out of the use. For easy walks (below 55% of max heart rate), watch calories are reduced by 25%, because they tend to be overestimated.
For strength training, CatLena counts 20 g per session plus 2.2 g per set (40 g when no sets are logged). Biopsy studies show muscle glycogen drops of 12% after one set and 24% after three [13], a drop of about 26% after a heavy leg session [14] and 23% to 44%, depending on fiber type, after a 45-minute session [15]. The per-set formula is CatLena’s own and is in the same range.
4. The daily balance
Today’s balance = yesterday’s balance + net intake − workouts, always between zero and capacity. The calculation starts 120 days before today, at 85% of capacity, and runs day by day up to today.
| Stamina (% of capacity) | Range (color of the % in the app) |
|---|---|
| above 80% | Loaded (green) |
| 60% to 80% | Adequate (blue) |
| 40% to 60% | Low (amber) |
| below 40% | Very low (red) |
Each workout also gets a demand badge, from its use relative to capacity: very low (under 5%), low (5% to 12%), moderate (12% to 20%), high (20% to 30%) and very high (over 30%).
CatLena’s own choices
- The K steps by VO₂ max, the share of lean mass that is muscle (53% in men, 45% in women) and liver at 1.4 g per kg follow the studies, but the round numbers are model choices.
- The heart-rate carbohydrate curve, the 20 g + 2.2 g per set for strength, glucose from protein (0.35 g per gram, up to 60 g) and the 2.5 g per kg daily limit do not come from a single study: they are CatLena approximations.
- That is why the absolute value can be off by about 30% to 40%. The change from one day to the next, which depends on the same math, is much more reliable.
How to adjust it
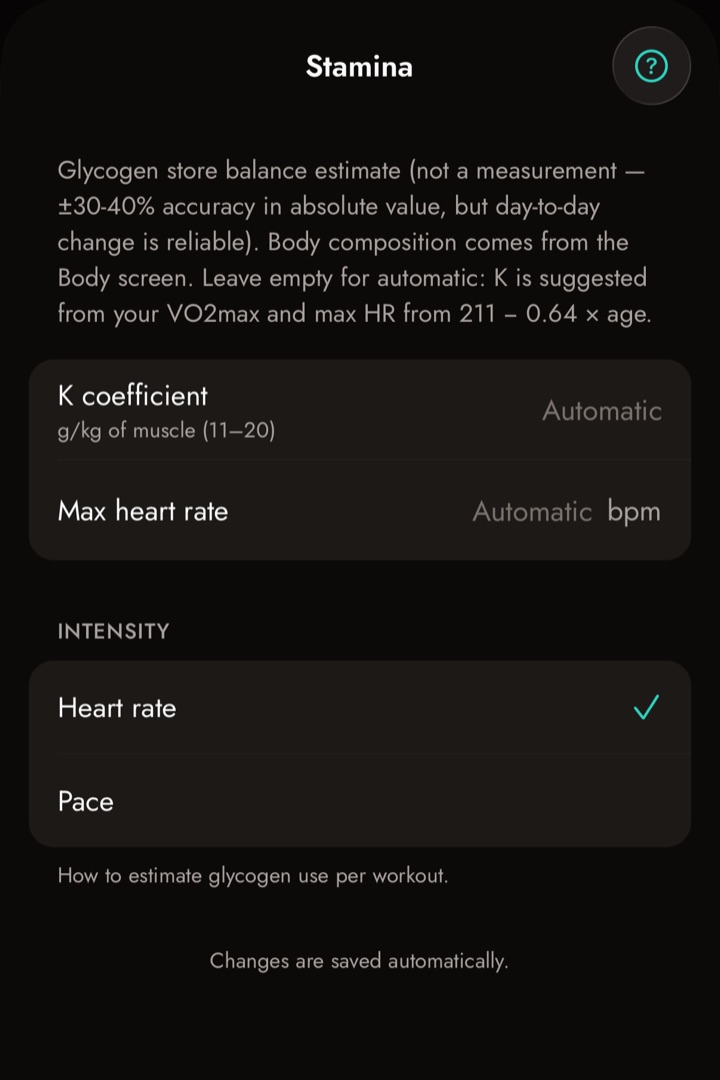
- In Settings › Stamina, you can set K yourself (for example, after a lab assessment) and your real max heart rate from a test.
- You can also choose whether intensity comes from heart rate or pace.
- Leave them empty and CatLena uses the automatic values described above. Without a VO₂ max, K is 15; without a logged body fat %, CatLena uses 18% (men), 26% (women) or 22% (sex not set).
References
- Jensen J, Rustad PI, Kolnes AJ, Lai YC. The role of skeletal muscle glycogen breakdown for regulation of insulin sensitivity by exercise. Frontiers in Physiology, 2011;2:112. See the study
- Janssen I, Heymsfield SB, Wang ZM, Ross R. Skeletal muscle mass and distribution in 468 men and women aged 18–88 yr. Journal of Applied Physiology, 2000;89(1):81–88. See the study
- Taylor R, Magnusson I, Rothman DL, et al. Direct assessment of liver glycogen storage by 13C nuclear magnetic resonance spectroscopy and regulation of glucose homeostasis after a mixed meal in normal subjects. Journal of Clinical Investigation, 1996;97(1):126–132. See the study
- Areta JL, Hopkins WG. Skeletal muscle glycogen content at rest and during endurance exercise in humans: a meta-analysis. Sports Medicine, 2018;48(9):2091–2102. See the study
- Slavin JL, Engstrom SK. Carbohydrates. Advances in Nutrition, 2024;15(11):100311. See the study
- Nuttall FQ, Gannon MC. Dietary protein and the blood glucose concentration. Diabetes, 2013;62(5):1371–1372. See the study
- Fromentin C, Tomé D, Nau F, et al. Dietary proteins contribute little to glucose production, even under optimal gluconeogenic conditions in healthy humans. Diabetes, 2013;62(5):1435–1442. See the study
- Ivy JL, Katz AL, Cutler CL, Sherman WM, Coyle EF. Muscle glycogen synthesis after exercise: effect of time of carbohydrate ingestion. Journal of Applied Physiology, 1988;64(4):1480–1485. See the study
- Kerksick CM, Arent S, Schoenfeld BJ, et al. International Society of Sports Nutrition position stand: nutrient timing. Journal of the International Society of Sports Nutrition, 2017;14:33. See the study
- Brooks GA, Mercier J. Balance of carbohydrate and lipid utilization during exercise: the "crossover" concept. Journal of Applied Physiology, 1994;76(6):2253–2261. See the study
- Nes BM, Janszky I, Wisløff U, Støylen A, Karlsen T. Age-predicted maximal heart rate in healthy subjects: the HUNT fitness study. Scandinavian Journal of Medicine & Science in Sports, 2013;23(6):697–704. See the study
- van Loon LJ, Greenhaff PL, Constantin-Teodosiu D, Saris WH, Wagenmakers AJ. The effects of increasing exercise intensity on muscle fuel utilisation in humans. Journal of Physiology, 2001;536(Pt 1):295–304. See the study
- MacDougall JD, Ray S, Sale DG, et al. Muscle substrate utilization and lactate production. Canadian Journal of Applied Physiology, 1999;24(3):209–215. See the study
- Tesch PA, Colliander EB, Kaiser P. Muscle metabolism during intense, heavy-resistance exercise. European Journal of Applied Physiology, 1986;55(4):362–366. See the study
- Koopman R, Manders RJ, Jonkers RA, et al. Intramyocellular lipid and glycogen content are reduced following resistance exercise in untrained healthy males. European Journal of Applied Physiology, 2006;96(5):525–534. See the study
See this math done for you
In CatLena, you log workouts, meals and measurements (or just chat with CatLena) and the app does this math for you, every day, on your computer and phone.
Get started