Nutrition
Side by side: fruit, sugars, snacks and drinks in tables
Calories, carbohydrate and fiber for 16 fruits, six sugars per 100 g and per 5 g, 12 snacks per 30 g and the alcohol and calories in each drink.
· 11 min read
Key points
- Whole fruit was associated with less weight gain over the years; sugary drinks, with more.
- Honey, brown sugar and white sugar have similar calories; brown sugar and molasses bring more iron and potassium, in small amounts per spoon.
- Per 30 g, peanuts, nuts and chocolate have similar calories but very different protein and fiber.
- A can of beer, a glass of wine and a shot of spirits each have about 14 g of alcohol and 100 kcal from alcohol alone.
Comparing foods in the same portion helps you choose without guilt or myths. This guide brings together four tables, for fruit, sugars, snacks and drinks, with what studies show about each group. Values were calculated by us from food composition tables and may vary from one product to another.
Fruit in everyday portions: 16 fruits
Per 100 g, an apple and cola have almost the same sugar, but the fruit brings fiber and has to be chewed. In 120,877 adults, each extra daily serving of fruit came with about 220 g less weight gain over 4 years, and each serving of sugary drink with about 450 g more; 100% fruit juice was in between, with about 140 g more [1]. In 133,468 adults, sweeter fruits were not linked to gain either [2], and with the same calories, apple pieces led to eating less at lunch than applesauce or juice [3].
| Fruit | Portion | kcal | Carbohydrate | Fiber |
|---|---|---|---|---|
| Silk banana | 1 medium (70 g) | 69 | 18.2 g | 1.4 g |
| Fuji apple with skin | 1 medium (130 g) | 72 | 19.8 g | 1.7 g |
| Pera orange | 1 medium (140 g) | 52 | 12.5 g | 1.1 g |
| Papaya | Half (150 g) | 60 | 15.6 g | 1.5 g |
| Tommy mango | 1 large slice (120 g) | 61 | 15.4 g | 2.5 g |
| Pineapple | 2 thin slices (150 g) | 72 | 18.4 g | 1.5 g |
| Watermelon | 1 medium slice (200 g) | 65 | 16.2 g | 0.2 g |
| Melon | 1 medium slice (150 g) | 44 | 11.2 g | 0.5 g |
| Strawberries | 10 berries (120 g) | 36 | 8.2 g | 2.0 g |
| Italia grapes | 1 small bunch (100 g) | 53 | 13.6 g | 0.9 g |
| Williams pear | 1 medium (130 g) | 69 | 18.2 g | 3.9 g |
| Red guava | 1 medium (170 g) | 92 | 22.1 g | 10.5 g |
| Kiwi | 1 fruit (75 g) | 38 | 8.6 g | 2.0 g |
| Ponkan tangerine | 1 medium (135 g) | 51 | 13.0 g | 1.2 g |
| Plum | 2 fruits (100 g) | 52 | 13.9 g | 2.4 g |
| Avocado | 2 tablespoons (60 g) | 58 | 3.6 g | 3.8 g |
Choose whole fruit most of the time. Fruit in syrup usually has added sugar, and dried fruit packs more calories into the same weight [4]. Long-term studies rely on self-reported intake and show association, not cause.
Six sugars in one table, per 100 g and per 5 g
Honey, brown sugar and white sugar are close in calories. The difference lies in minerals, which show up per 100 g and nearly vanish per spoonful. Demerara sugar is not in the Brazilian table [5]; for it, check the label.
| Per 100 g | kcal | Iron | Potassium |
|---|---|---|---|
| Refined | 387 | 0.1 mg | 6 mg |
| Granulated | 387 | 0.2 mg | 3 mg |
| Brown sugar | 369 | 8.3 mg | 522 mg |
| Rapadura (raw cane sugar) | 352 | 4.4 mg | 459 mg |
| Honey | 309 | 0.3 mg | 99 mg |
| Cane molasses | 297 | 5.4 mg | 395 mg |
| Per 5 g (1 teaspoon) | kcal | Iron | Potassium |
|---|---|---|---|
| Refined or granulated | 19 | Less than 0.1 mg | Less than 1 mg |
| Brown sugar | 18 | 0.4 mg | 26 mg |
| Rapadura | 18 | 0.2 mg | 23 mg |
| Honey | 15 | Less than 0.1 mg | 5 mg |
| Cane molasses | 15 | 0.3 mg | 20 mg |
For comparison, 100 g of cooked pinto beans have 1.3 mg of iron and 255 mg of potassium [5]. The spoon changes the math too: 1 tablespoon of honey weighs 21 g, about 65 kcal, and one of white sugar 12.6 g, about 49 kcal [6]. Weigh your own spoon once.
In studies, 55 adults who had 50 g per day of honey, regular sugar or corn syrup, 2 weeks each, showed no difference in glucose, insulin or weight [7]. A review found small improvements with honey, mostly with low certainty and compared with the usual diet [8], and honey and brown sugar have more antioxidants than white sugar, measured in the food [9]. The World Health Organization counts all of them as free sugars and suggests less than 10% of daily calories, about 50 g of sugar on a 2,000 kcal diet [10].
12 snacks in the same 30 g portion
| Per 30 g | kcal | Protein | Fiber |
|---|---|---|---|
| Roasted salted peanuts | 182 | 6.8 g | 2.3 g |
| Paçoca (peanut candy) | 146 | 4.8 g | 2.2 g |
| Roasted salted almonds | 174 | 5.6 g | 3.5 g |
| Roasted cashews | 171 | 5.5 g | 1.1 g |
| Raw Brazil nuts | 193 | 4.3 g | 2.4 g |
| Raw walnuts | 186 | 4.2 g | 2.2 g |
| Milk chocolate | 162 | 2.2 g | 0.7 g |
| Semisweet chocolate | 142 | 1.5 g | 1.5 g |
| Chocolate sandwich cookie | 142 | 1.9 g | 0.9 g |
| Potato chips | 163 | 1.7 g | 0.8 g |
| Popcorn with oil, unsalted | 134 | 3.0 g | 4.3 g |
| Banana candy bar | 84 | 0.7 g | 1.1 g |
The table number is a prediction: in whole almonds, measured energy was 129 kcal per 28 g, versus 168 to 170 kcal predicted [11], while in almond butter the measurement matched the prediction [12]. People who ate whole peanuts excreted more fat than those who ate peanut butter or oil [13].
In 25 adults who added 20 kcal per kilogram per day for 2 weeks, weight rose with sweets and did not increase significantly with peanuts [14]. In 15 adults eating about 505 kcal of peanuts per day for 8 weeks, 66% of those calories were offset by eating less of everything else, and weight gain was 1 kg versus 3.6 kg predicted [15]. These are short, small studies; peanuts still add calories, and people with allergies must avoid them.
Counting each drink: alcohol and calories
The math uses volume, alcohol content, the density of alcohol (0.789 g per mL) and 7 kcal per gram; only the alcohol counts, and sugar and mixers add more. The reference is the US standard drink, about 14 g of alcohol [16]. If you do not drink, there is no reason to start.
| Drink | Volume and strength | Alcohol | kcal from alcohol |
|---|---|---|---|
| Draft beer | 300 mL, 5% | 12 g | 83 |
| Beer, small bottle | 330 mL, 5% | 13 g | 91 |
| Beer, can | 350 mL, 5% | 14 g | 97 |
| Strong beer | 350 mL, 10% | 28 g | 193 |
| Wine or sparkling wine | 150 mL, 12% | 14 g | 99 |
| Spirits | 45 mL, 40% | 14 g | 99 |
In tests with young adults, those who drank ate an average of 82 kcal more and 256 kcal more in total [17]. Alcohol brings sleep on faster and increases awakenings in the second half of the night [18], and in 4,098 Finns, heart-based recovery fell more the higher the dose [19]. After training, about 12 drinks reduced muscle protein production by 24%, even with 25 g of protein [20]; 1 g of alcohol per kilogram reduced strength [21], and 0.5 g per kilogram did not [22].
- Check the alcohol content on the label and use the table.
- Do not swap a meal for a drink: have your meal with protein at the usual time.
- Avoid drinking to fall asleep and, on heavy training days, put recovery first.
- Never drive after drinking.
How CatLena uses it
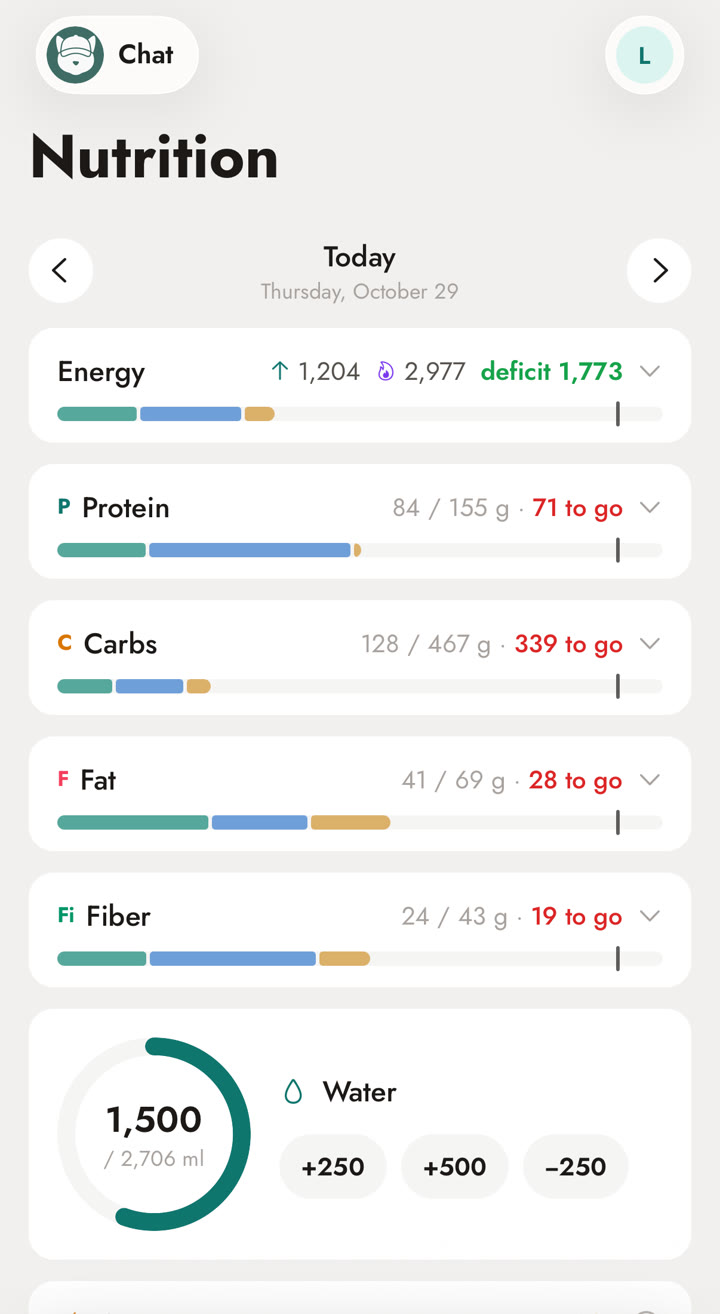
On the Nutrition screen, every fruit, spoon of sugar, snack or drink you log goes into the day’s total with energy, protein, carbohydrate, fat and fiber. In the example below, the day’s energy was 1,204 kcal, with 24 g of fiber out of a 43 g target. One guava, with 10.5 g of fiber, would close a good part of that gap.
When to see a professional
References
- Mozaffarian D, Hao T, Rimm EB, Willett WC, Hu FB. Changes in diet and lifestyle and long-term weight gain in women and men. The New England journal of medicine, 2011;364(25):2392-404. See the study
- Bertoia ML, Mukamal KJ, Cahill LE, Hou T, Ludwig DS, Mozaffarian D, et al. Changes in Intake of Fruits and Vegetables and Weight Change in United States Men and Women Followed for Up to 24 Years: Analysis from Three Prospective Cohort Studies. PLoS medicine, 2015;12(9):e1001878. See the study
- Flood-Obbagy JE, Rolls BJ. The effect of fruit in different forms on energy intake and satiety at a meal. Appetite, 2009;52(2):416-22. See the study
- Sharma SP, Chung HJ, Kim HJ, Hong ST. Paradoxical Effects of Fruit on Obesity. Nutrients, 2016;8(10). See the study
- Núcleo de Estudos e Pesquisas em Alimentação (NEPA), Universidade Estadual de Campinas. Tabela Brasileira de Composição de Alimentos (TACO). 4ª ed. Campinas: NEPA-Unicamp, 2011. See the study
- U.S. Department of Agriculture, Agricultural Research Service. FoodData Central, 2019. See the study
- Raatz SK, Johnson LK, Picklo MJ. Consumption of Honey, Sucrose, and High-Fructose Corn Syrup Produces Similar Metabolic Effects in Glucose-Tolerant and -Intolerant Individuals. The Journal of nutrition, 2015;145(10):2265-72. See the study
- Ahmed A, Tul-Noor Z, Lee D, Bajwah S, Ahmed Z, Zafar S, et al. Effect of honey on cardiometabolic risk factors: a systematic review and meta-analysis. Nutrition reviews, 2023;81(7):758-774. See the study
- Phillips KM, Carlsen MH, Blomhoff R. Total antioxidant content of alternatives to refined sugar. Journal of the American Dietetic Association, 2009;109(1):64-71. See the study
- World Health Organization. Guideline: sugars intake for adults and children. Geneva: WHO, 2015. See the study
- Novotny JA, Gebauer SK, Baer DJ. Discrepancy between the Atwater factor predicted and empirically measured energy values of almonds in human diets. The American journal of clinical nutrition, 2012;96(2):296-301. See the study
- Gebauer SK, Novotny JA, Bornhorst GM, Baer DJ. Food processing and structure impact the metabolizable energy of almonds. Food & function, 2016;7(10):4231-4238. See the study
- Traoret CJ, Lokko P, Cruz AC, Oliveira CG, Costa NM, Bressan J, et al. Peanut digestion and energy balance. International journal of obesity (2005), 2008;32(2):322-8. See the study
- Claesson AL, Holm G, Ernersson A, Lindström T, Nystrom FH. Two weeks of overfeeding with candy, but not peanuts, increases insulin levels and body weight. Scandinavian journal of clinical and laboratory investigation, 2009;69(5):598-605. See the study
- Alper CM, Mattes RD. Effects of chronic peanut consumption on energy balance and hedonics. International journal of obesity and related metabolic disorders : journal of the International Association for the Study of Obesity, 2002;26(8):1129-37. See the study
- National Institute on Alcohol Abuse and Alcoholism. What is a standard drink? Bethesda: NIAAA. See the study
- Kwok A, Dordevic AL, Paton G, Page MJ, Truby H. Effect of alcohol consumption on food energy intake: a systematic review and meta-analysis. The British journal of nutrition, 2019;121(5):481-495. See the study
- Ebrahim IO, Shapiro CM, Williams AJ, Fenwick PB. Alcohol and sleep I: effects on normal sleep. Alcoholism, clinical and experimental research, 2013;37(4):539-49. See the study
- Pietilä J, Helander E, Korhonen I, Myllymäki T, Kujala UM, Lindholm H. Acute Effect of Alcohol Intake on Cardiovascular Autonomic Regulation During the First Hours of Sleep in a Large Real-World Sample of Finnish Employees: Observational Study. JMIR mental health, 2018;5(1):e23. See the study
- Parr EB, Camera DM, Areta JL, Burke LM, Phillips SM, Hawley JA, et al. Alcohol ingestion impairs maximal post-exercise rates of myofibrillar protein synthesis following a single bout of concurrent training. PloS one, 2014;9(2):e88384. See the study
- Barnes MJ, Mündel T, Stannard SR. Post-exercise alcohol ingestion exacerbates eccentric-exercise induced losses in performance. European journal of applied physiology, 2010;108(5):1009-14. See the study
- Barnes MJ, Mündel T, Stannard SR. A low dose of alcohol does not impact skeletal muscle performance after exercise-induced muscle damage. European journal of applied physiology, 2011;111(4):725-9. See the study
See this math done for you
In CatLena, you log workouts, meals and measurements (or just chat with CatLena) and the app does this math for you, every day, on your computer and phone.
Get started