Running
Race pace: the Boston benchmark, carbon-plated shoes and the 30 km wall
Boston qualifying times as pace per kilometer, what 1%, 2% and 3% shoe economy is worth in your finish time and a 5 km split plan to avoid hitting the wall.
· 10 min read
Key points
- The Boston qualifying time for men aged 18 to 34 is 2:55, or 4:09 per kilometer; for women, 3:25, or 4:52.
- Carbon-plated shoes saved about 4% of energy in elite runners; at amateur paces, the measured gain was smaller and varied widely.
- In more than 4 million marathon results, the wall started on average around km 29 and cost more than 30 minutes.
- Writing down your pace for each segment before the start and holding back early is the simplest way to avoid the wall.
A race pace is decided before the start. This guide turns the time many runners use as a benchmark, the Boston Marathon qualifier, into pace per kilometer, shows how much carbon-plated shoes may be worth in your finish time and offers a plan to pace a marathon every 5 km, with what studies show about the wall.
Boston as pace per kilometer
The Boston Marathon requires a minimum time by age and sex [1]. Women and non-binary runners use the times in the women’s column, and age is the age on race day. Pace per kilometer is our calculation: the time divided by 42.195 km.
| Age | Men | Women |
|---|---|---|
| 18 to 34 | 2:55 (4:09/km) | 3:25 (4:52/km) |
| 35 to 39 | 3:00 (4:16/km) | 3:30 (4:59/km) |
| 40 to 44 | 3:05 (4:23/km) | 3:35 (5:06/km) |
| 45 to 49 | 3:15 (4:37/km) | 3:45 (5:20/km) |
| 50 to 54 | 3:20 (4:44/km) | 3:50 (5:27/km) |
| 55 to 59 | 3:30 (4:59/km) | 4:00 (5:41/km) |
| 60 to 64 | 3:50 (5:27/km) | 4:20 (6:10/km) |
| 65 to 69 | 4:05 (5:48/km) | 4:35 (6:31/km) |
| 70 or older | From 4:20 | From 4:50 |
In 2027, meeting the standard was not enough: getting in required running 5 minutes and 17 seconds under it. For comparison with amateurs, in a survey of 2,303 runners, half finished the marathon in 3:28 or less among men and 3:54 among women, and the 10 km in 44:51 and 54:58 [2]. Times were self-reported, and the group was faster than the average race field.
- Write down your best recent time at a given distance.
- Divide the minutes by the kilometers to find your pace.
- In a few months, repeat the same distance and compare with yourself.
Carbon-plated shoes: what 1%, 2% and 3% are worth in your time
Studies measure the effect of carbon-plated shoes as energy savings. In elite runners, average savings were 4%, at paces of 3:20 to 4:17 per kilometer [3]. In amateurs, they were 1.4% at 5 minutes per kilometer and 0.9% at 6 minutes, a value the study could not confirm [4]. A study of 30 recreational runners saw a larger drop in oxygen use [5], and an expert review sums up the gain as 2% to 4% [6].
| Pace and race | 1% | 2% | 3% |
|---|---|---|---|
| 5 min/km, 10 km | 30 s | 59 s | 1 min 27 s |
| 5 min/km, 21.1 km | 1 min 3 s | 2 min 4 s | 3 min 4 s |
| 6 min/km, 10 km | 36 s | 1 min 11 s | 1 min 45 s |
| 6 min/km, 21.1 km | 1 min 15 s | 2 min 29 s | 3 min 41 s |
| 7 min/km, 10 km | 42 s | 1 min 22 s | 2 min 2 s |
| 7 min/km, 21.1 km | 1 min 28 s | 2 min 54 s | 4 min 18 s |
The table is our calculation, assuming that 1% less energy cost becomes about 1% more speed. Each runner responds differently: in 7 amateurs, results ranged from a 9.7% gain to a 1.1% loss [7]. Uphills and downhills reduce the effect [8], and a 3 km test in runners who run 10 km in 38 to 45 minutes showed only 5 seconds saved [9]. Injury data are still limited, and experts suggest switching footwear gradually [10].
Wall plan: your pace every 5 km
Barry Smyth analyzed more than 4 million marathon times and defined the wall as a pace drop of 25% or more for at least 5 km late in the race. 28% of men and 17% of women hit the wall, with the drop starting on average at km 29.6 and km 29.3; those who hit it finished about 31.5 and 33.2 minutes slower than their estimated best [11]. Runners chasing a personal best hit it more often, which the author attributes to an aggressive early pace.
In the body, a model calculated that the faster the pace, the shorter the distance stored carbohydrate can last [12]. In the mind, among 66 London amateurs, focusing on bodily symptoms was associated with hitting the wall earlier, and being distracted by the surroundings with hitting it later [13].
A filled-in example for a 4-hour marathon, at about 5:41 per kilometer:
| Segment | Pace | Elapsed time | What to watch |
|---|---|---|---|
| 0 to 5 km | 5:45 | 28:45 | Hold back at the start |
| 5 to 20 km | 5:40 | 1:53 | Eat and drink as in training |
| 20 to 30 km | 5:40 | 2:50 | Breathing under control |
| 30 to 40 km | 5:40 to 5:50 | 3:47 | Next sign, people around you |
| 40 km to finish | Whatever is left | 4:00 | Finish well |
- Write down a maximum pace up to km 20 and slow down if you are faster.
- Decide in advance what to do if your pace drops, for example walking 1 minute at the next water station.
- Choose where to look when it gets hard: the next sign, the next station, someone ahead.
How CatLena uses it
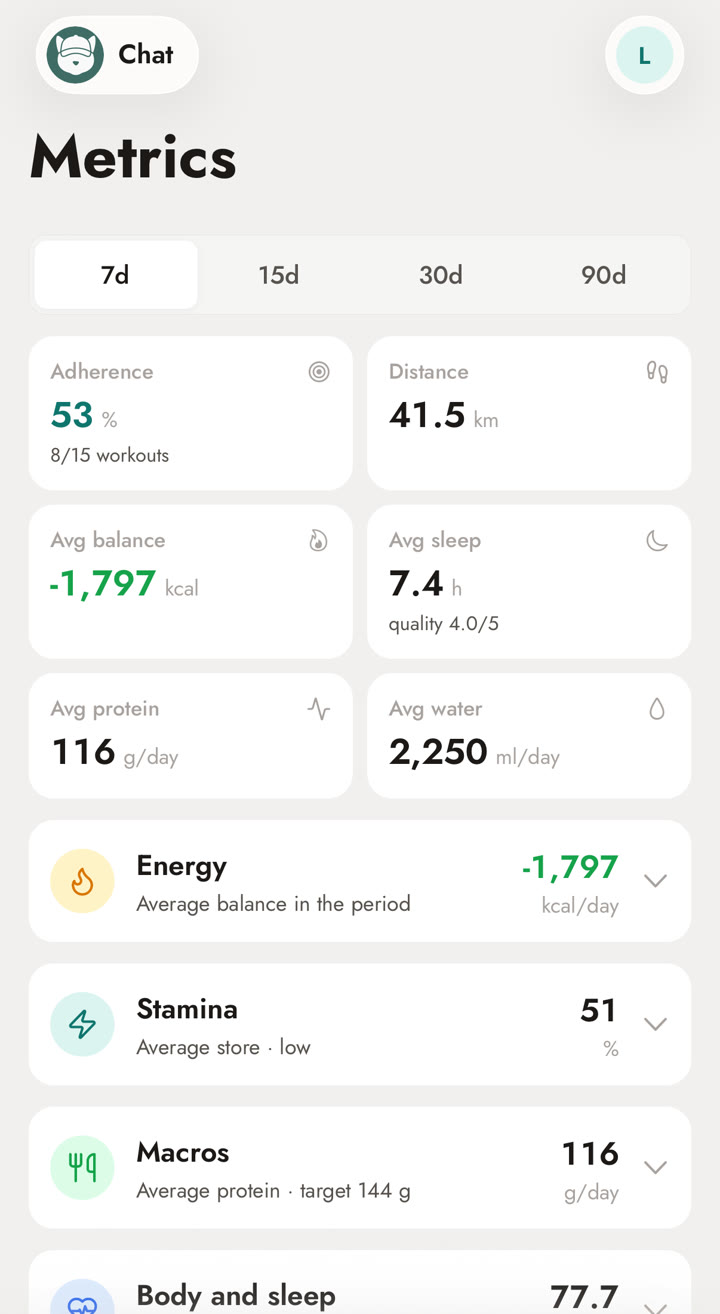
On the Metrics screen, the distance run in the period appears next to the energy balance, sleep and stamina. In the example below, the week added up to 41.5 km, close to a typical amateur marathoner’s volume, and average stamina was 51%. Tracking these numbers in the weeks before the race helps you choose a pace your training supports.
When to see a professional
References
- Boston Athletic Association. Boston Marathon qualifying standards, 2027. See the study
- Vickers AJ, Vertosick EA. An empirical study of race times in recreational endurance runners. BMC sports science, medicine & rehabilitation, 2016;8(1):26. See the study
- Hoogkamer W, Kipp S, Frank JH, Farina EM, Luo G, Kram R. A Comparison of the Energetic Cost of Running in Marathon Racing Shoes. Sports medicine (Auckland, N.Z.), 2018;48(4):1009-1019. See the study
- Joubert DP, Dominy TA, Burns GT. Effects of Highly Cushioned and Resilient Racing Shoes on Running Economy at Slower Running Speeds. International journal of sports physiology and performance, 2023;18(2):164-170. See the study
- Wang W, Potthast W, Torniainen K, Xu S, Ammann K, Jing Y, et al. Performance Benefits Without Added Injury Risk? Effects of Advanced Footwear Technology on Running Economy and Biomechanical Risk in Recreational Runners. Scandinavian journal of medicine & science in sports, 2026;36(4):e70275. See the study
- Hooren BV, Vanwanseele B, Matijevich E, Gronwald T, Giandolini M, Hanley B, et al. Advanced Footwear Technology in Distance Running: What We Know, What We Don’t Know, and Future Directions. European journal of sport science, 2026;26(11):e70266. See the study
- Knopp M, Muñiz-Pardos B, Wackerhage H, Schönfelder M, Guppy F, Pitsiladis Y, et al. Variability in Running Economy of Kenyan World-Class and European Amateur Male Runners with Advanced Footwear Running Technology: Experimental and Meta-analysis Results. Sports medicine (Auckland, N.Z.), 2023;53(6):1255-1271. See the study
- Whiting CS, Hoogkamer W, Kram R. Metabolic cost of level, uphill, and downhill running in highly cushioned shoes with carbon-fiber plates. Journal of sport and health science, 2022;11(3):303-308. See the study
- Rodrigo-Carranza V, Hoogkamer W, Salinero JJ, Rodríguez-Barbero S, González-Ravé JM, González-Mohíno F. Influence of Running Shoe Longitudinal Bending Stiffness on Running Economy and Performance in Trained and National Level Runners. Medicine and science in sports and exercise, 2023;55(12):2290-2298. See the study
- Tenforde A, Hoenig T, Saxena A, Hollander K. Bone Stress Injuries in Runners Using Carbon Fiber Plate Footwear. Sports medicine (Auckland, N.Z.), 2023;53(8):1499-1505. See the study
- Smyth B. How recreational marathon runners hit the wall: A large-scale data analysis of late-race pacing collapse in the marathon. PloS one, 2021;16(5):e0251513. See the study
- Rapoport BI. Metabolic factors limiting performance in marathon runners. PLoS computational biology, 2010;6(10):e1000960. See the study
- Stevinson CD, Biddle SJ. Cognitive orientations in marathon running and "hitting the wall". British journal of sports medicine, 1998;32(3):229-34; discussion 234-5. See the study
See this math done for you
In CatLena, you log workouts, meals and measurements (or just chat with CatLena) and the app does this math for you, every day, on your computer and phone.
Get started